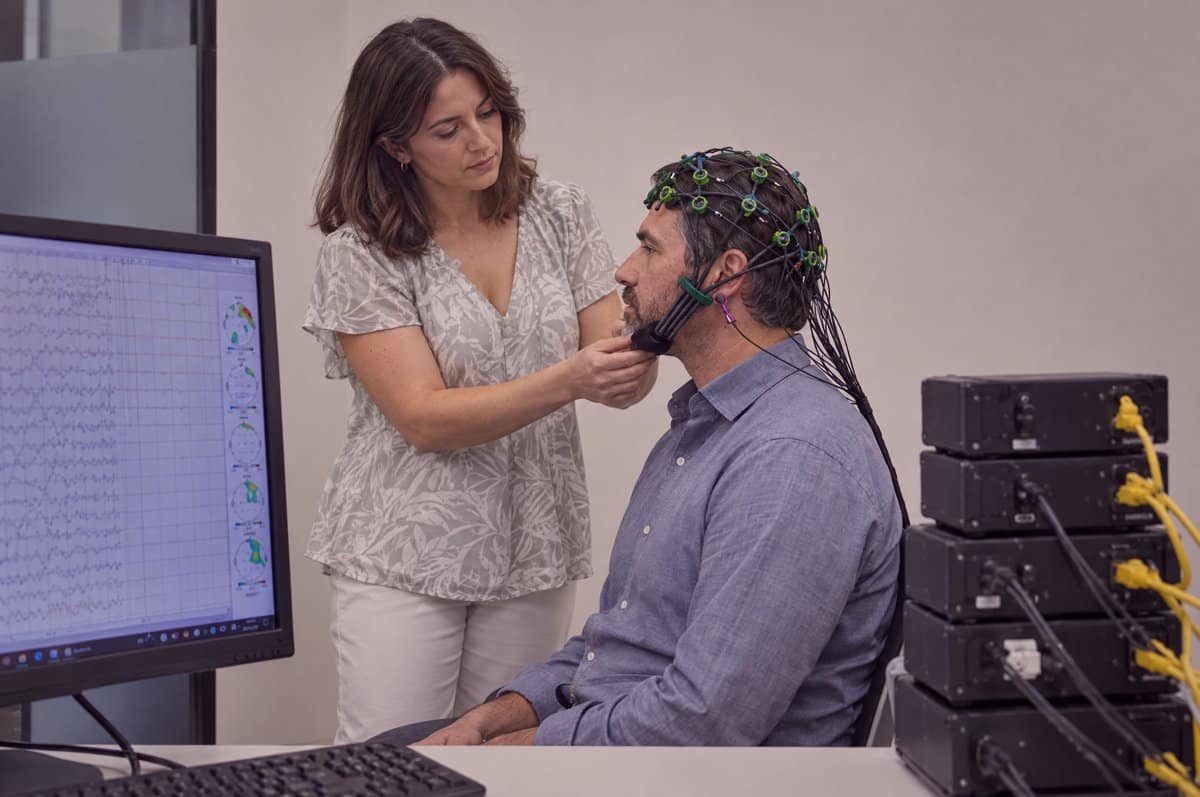
A city can be studied in two ways. You can stand at one busy intersection and count the cars. Or you can look at a live traffic map of the whole city and see where the traffic flows well, where it slows down, and how one district affects another. Classical neurofeedback is closer to the first view. LORETA neurofeedback, and in particular LORETA Z-score neurofeedback, tries to offer the second view: a map of brain activity across many brain regions at once, compared with a reference.
In this article, we explain where LORETA comes from, what a Z-score is, what the research says today, where the limits are, and how we use this method at Neurofeedback Luxembourg. It is written for adults, parents and professionals who want to understand the method before they choose a training programme.
Where LORETA comes from: a short history
From the scalp to the inside of the brain
The story starts with the electroencephalogram (EEG). Since the first human recordings by Hans Berger in the 1920s, EEG has measured the small electrical activity of the brain through sensors placed on the scalp. For decades, this information stayed on the surface. A sensor on the scalp picks up a mixture of signals from many structures below it. It cannot say on its own where in the brain a signal starts.
Scientists call this question the “inverse problem”: from what we measure on the surface, can we estimate the sources inside the head? There is no single exact answer, because many different source patterns can produce the same pattern on the scalp (Grech et al., 2008). Every method that solves the inverse problem has to make assumptions.
1994: low resolution electromagnetic tomography
In 1994, Roberto Pascual-Marqui, Christoph Michel and Dietrich Lehmann, working in Switzerland, published a method called low resolution electromagnetic tomography, or LORETA (Pascual-Marqui, Michel & Lehmann, 1994). The idea was simple and elegant. Neighbouring areas of the cortex tend to be active together, so the method looks for the smoothest distribution of activity that explains the scalp data. The result is a three-dimensional estimate of where activity comes from, in thousands of small volume units called voxels.
The word “low resolution” is important and honest. LORETA does not produce a sharp photograph like an MRI scan. It produces a blurred but useful estimate of source location.
Working with LORETA: sLORETA, eLORETA and swLORETA
The method has evolved several times:
- sLORETA (standardized LORETA) was published in 2002. It standardizes the estimates so that, under ideal test conditions, the location of a single source is estimated with zero localisation error (Pascual-Marqui, 2002).
- eLORETA (exact LORETA) followed in 2007 and improved the estimates further, including in the presence of noise (Pascual-Marqui, 2007).
- swLORETA (standardized weighted LORETA) was described by Palmero-Soler and colleagues in 2007. It adds a weighting step designed to make the estimates more robust for deeper sources (Palmero-Soler et al., 2007).
These are tools for estimating sources. They are not, on their own, a training method. The step from imaging to training came from another line of work: normative databases and Z-scores. Today, the term swLORETA neurofeedback (sometimes written “neurofeedback swLORETA”) usually describes training systems that combine the swLORETA source model with this kind of feedback.
Normative databases and the Z-score approach
From the 1970s onward, researchers such as Robert Thatcher and E. Roy John built large databases of EEG recordings from healthy people of different ages. With such a database, a person’s quantitative EEG (qEEG) can be compared with an age-matched reference group. Thatcher and colleagues later built a normative database for LORETA sources and tested its reliability and validity (Thatcher, North & Biver, 2005).
Around 2006 to 2009, Thomas Collura, Robert Thatcher and colleagues brought these ideas into real-time training. Their “live Z-score” approach computes Z-scores from the EEG many times per second and gives feedback on them during the session (Collura et al., 2010). Combining live Z-scores with LORETA sources produced what is now called LORETA Z-score neurofeedback.
What is a Z-score, in plain words?
A Z-score is a measure of distance from an average. It says how far a value is from the mean of a reference group, in units of standard deviation.
- A Z-score of 0 means the value is exactly at the average of the reference group.
- A Z-score of +1 or -1 means the value is one standard deviation above or below the average. About two thirds of healthy people in the reference group fall between -1 and +1.
- A Z-score of +2 or -2 is less common. About 95% of the reference group falls between -2 and +2.
So, is a higher Z-score good or bad? Neither, by itself. A Z-score is not a grade. It only says “this measure is unusual compared with people of the same age”. An unusual value can be a strength, a compensation, or simply individual variation. This is why Z-scores must always be read together with the person’s goals, history and experience. There is no “good” Z-score in general. For training purposes, values far from zero are the ones worth discussing.
In Z-score neurofeedback, the training software looks at many measures at the same time: power in each frequency band (the frequency domain), the balance between bands, and the coordination between sites or regions (often called coherence and phase). Feedback is given when more of these measures move toward the reference range.
Surface training and source training: two levels of the map
Classical amplitude training
Classical neurofeedback usually works with one to four sensors. It trains the amplitude of a frequency band at a specific site, for example more of one rhythm and less of another at one point on the scalp. This is the intersection in our city metaphor. It is simple and has the longest research history of the three approaches.
19-channel surface Z-score training
With 19 channels, the full standard 10-20 set of sensor positions, training can include all scalp sites. Now the feedback can reflect how the whole surface map compares with the reference, including the connections between sites. Why about 19 channels? Because that is the standard montage used to build most normative qEEG databases. Training with the same montage as the database keeps the comparison consistent.
LORETA Z-score training: estimating the sources
LORETA Z-score training goes one step further. It uses the 19 scalp signals to estimate activity in brain regions inside the head, then compares these estimated sources with the normative database. The training targets can be specific regions of interest, or networks of regions that are known to work together.
Networks and hubs
Modern neurosciences describe brain function less as a set of separate brain areas and more as a set of networks. Some regions act as hubs: like large railway stations, many routes pass through them. Examples of commonly studied networks include the default mode network (active during rest and inner thought), the salience network (which helps detect what matters) and the central executive network (which supports focused, goal-directed work).
The aim of network-based training is not to “repair” a single spot. It is to give the brain feedback about the coordination of several regions and hubs at once, so that it can learn a more flexible and balanced pattern of function.
| Approach | Number of sensors | What is trained | City metaphor |
|---|---|---|---|
| Classical amplitude training | 1 to 4 | Amplitude of a frequency band at a site | One intersection |
| 19-channel surface Z-score | 19 | Scalp measures and connections compared with a reference | The map of the main roads |
| LORETA Z-score | 19 | Estimated source activity in regions and networks compared with a reference | The traffic map of the districts below the roads |
What does the research say today?
Neurofeedback as a whole has a large literature, built over more than 50 years. LORETA and Z-score neurofeedback are much younger, and the research base is smaller and still developing. It is useful to separate three things: what studies have found, what remains uncertain, and what is still a hypothesis.
Study findings
- Thatcher and colleagues reported that LORETA source estimates computed from a normative database showed acceptable reliability and validity for use as a reference (Thatcher, North & Biver, 2005).
- Collura and colleagues published case studies showing that live Z-score training was feasible in practice and that Z-scores moved toward the reference range over sessions (Collura et al., 2010).
- Wigton and Krigbaum reported a pilot study in a practice setting in which participants with attention difficulties who completed 19-channel Z-score neurofeedback showed improvements on measures of attention, executive function and behaviour, and qEEG measures moved closer to the reference (Wigton & Krigbaum, 2019). This was a pilot study without a control group.
- Krigbaum and Wigton discussed how the choice of training modality, such as surface or source training, may change what is being trained (Krigbaum & Wigton, 2014), and later reviewed the use of qEEG to guide neurofeedback protocols (Wigton & Krigbaum, 2015).
What remains uncertain
In 2019, Coben, Hammond and Arns published a critical review with a direct title: “19 channel Z-score and LORETA neurofeedback: does the evidence support the hype?” (Coben, Hammond & Arns, 2019). The authors concluded that most published data come from case series and uncontrolled studies, and that well-controlled trials were still missing. They also noted that standard, well-established protocols have a stronger evidence base for some goals. Reviews of classical protocols, such as Arns, Heinrich and Strehl (2014), show how long the road to solid evidence can be, even for methods that have been studied for decades.
We think this criticism is useful. It reminds everyone that a new method needs controlled studies, not only enthusiasm. Some websites present LORETA as validated by hundreds of studies or as the most advanced method in every case. The honest position is more modest: LORETA source imaging is a well-documented research tool, while LORETA Z-score training is a promising approach whose evidence base is still growing.
Hypotheses that are being tested
Several ideas are still hypotheses. One is that training networks rather than single sites may need fewer sessions. Another is that source training may help to reach deeper structures more specifically than surface training. These ideas are plausible, but they have not yet been confirmed by controlled trials.
The limits, explained plainly
Every map has a scale, and every map can be wrong in places. LORETA is no exception.
- The inverse problem. Source estimates are estimates, and there is no perfect solution. Different methods make different assumptions, and none can recover the exact sources from scalp data alone (Grech et al., 2008).
- Spatial resolution. With 19 sensors, the resolution is low. Regions that are close together can blur into each other. Deep structures are harder to estimate than the outer cortex.
- Dependence on the normative database. A Z-score is only as good as the reference group. The age range, recording conditions, software and quality of the database all matter.
- Data quality. Eye movements, muscle tension and poor sensor contact can distort the signal. Careful recording, good signal quality and artifact review by trained practitioners are essential.
- A Z-score is not a goal in itself. Moving every number toward zero is not the aim. The aim is to support the person’s own goals, and the numbers are one guide among others.
How we use LORETA Z-score neurofeedback at Neurofeedback Luxembourg
Our approach follows one principle: to change something, you first have to measure it. We use LORETA Z-score training as one part of a measurement-led programme, not as a stand-alone technique.
Step 1: understand your goals
Every programme begins with a conversation. What would you like to change in your daily life? Better focus at work, more calm under stress, a steadier sleep rhythm, or support during a demanding period? Your goals guide everything that follows.
Step 2: measure with a 19-channel qEEG BrainMap
We then record a 19-channel EEG at rest and analyse it quantitatively against a normative, age-matched database. The qEEG BrainMap also includes cognitive tests and questionnaires, and you receive a written report. The BrainMap is for orientation and training planning, not a medical diagnosis.
Step 3: discuss the findings together
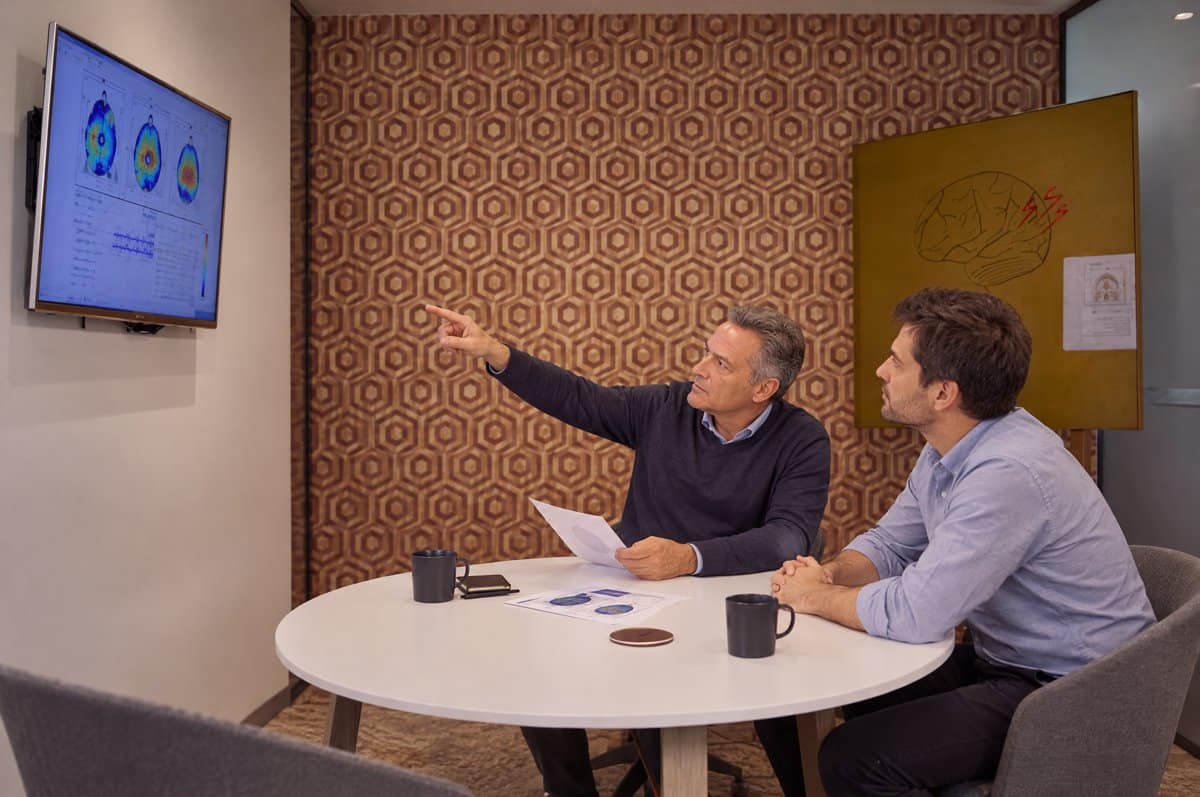
We take time to explain the brain map in plain language, and you also receive a written description of the findings. We look at which patterns are close to the reference, which are further away, and how this may or may not relate to your experience. This interpretation requires expert review. We do not read Z-scores in isolation. A value far from the average only becomes relevant when it makes sense in the context of your goals and history.
Step 4: build a qEEG-guided training plan
Based on the BrainMap and the discussion, we design a personalised neurofeedback training plan. In many cases it combines two levels:
- Classical amplitude training at selected sites, for well-studied, focused goals.
- LORETA Z-score network training with 19 channels, to give feedback on the coordination of several brain regions and hubs at once.
Each neurofeedback training session lasts one hour. During each session, you sit comfortably while the software analyses your brain activity in real time. When more of the trained measures move in the desired direction, you receive feedback, for example a film that becomes clearer or a sound that continues. Over the sessions, the brain learns through this feedback. This learning is based on operant conditioning and on neuroplasticity, the ability of the brain to adapt. If you want to compare methods, our guide to the types of neurofeedback explains the main options.
Step 5: reassess at the end
At the end of the programme, we record a new BrainMap and compare it with the first one. We also look again at your goals and questionnaires. This reassessment shows what has changed in the results of the brain map and in daily life, and it helps to decide on the next steps. You can read more about each stage on our process page.
An illustrative example
The following is an illustrative composite, not a real client. Imagine an adult professional who wants to feel calmer and concentrate better during long working days. The BrainMap shows several measures far from the reference in regions that belong to an attention-related network, while most other measures are close to average. Together, we decide to combine a short block of classical amplitude training with LORETA Z-score training focused on that network. After the programme, the final BrainMap and the questionnaires are compared with the first ones, and the discussion focuses on what the person notices in daily life. Experiences differ from person to person, and no specific result can be promised.
Looking ahead: from snapshots to living maps
When the first LORETA paper appeared in 1994, the method required powerful computers and hours of analysis. Today, source estimates can be computed many times per second during a training session. That change alone shows how fast the field is moving.
The next steps look promising. Larger normative databases are being built. Better head models, more sensors and improved artifact handling may sharpen the resolution of the map. Researchers are designing controlled studies to test which people benefit most from network-based training, and with how many sessions. Network neuroscience is also improving our understanding of how hubs and networks support attention, emotion and rest.
We see LORETA Z-score neurofeedback as part of a broader movement: from training a single point to understanding and supporting the brain as a connected system. Neurofeedback can reduce stress and anxiety and can improve concentration for many people, and network-based methods may make training more precise and more personal. The map is becoming clearer every year, and we are glad to help people read their own.
Your next step
If you are curious whether LORETA Z-score neurofeedback could fit your goals, the first step is simple:
- A free telephone call to talk about your goals and answer your questions.
- A qEEG BrainMap to measure and discuss your brain activity.
- A personalised training programme, if it makes sense for you.
You can contact us at +352 42 31 55 44 or [email protected]. Sessions take place in our offices in Luxembourg-Gare.
Frequently asked questions
What is LORETA neurofeedback?
LORETA neurofeedback is a form of neurofeedback that uses 19 EEG sensors to estimate activity in brain regions inside the head, using low resolution electromagnetic tomography. Training can then focus on specific regions or on networks of regions, rather than on one point on the scalp.
What is Z-score neurofeedback?
Z-score neurofeedback compares your brain activity, in real time, with a normative reference group of people of the same age. Each measure is expressed as a Z-score: the distance from the average of the reference group. Feedback is given when more measures move toward the reference range.
What is the difference between sLORETA, eLORETA and swLORETA?
They are versions of the same source imaging method. sLORETA (2002) standardizes the estimates, eLORETA (2007) aims for exact localisation under ideal conditions, and swLORETA (2007) adds a weighting step intended to improve robustness for deeper sources. All are estimates with low spatial resolution.
Is qEEG brain mapping real?
Yes. Quantitative EEG is a well-established way to measure and analyse brain electrical activity and to compare it with normative data. Its interpretation requires care. At Neurofeedback Luxembourg, a BrainMap is for orientation and training planning, not a medical diagnosis.
Is LORETA Z-score neurofeedback scientifically proven?
The research base is promising but still developing. Studies so far are mostly case series and pilot studies, and controlled trials are still needed (Coben, Hammond & Arns, 2019). We present it as a training approach grounded in published research, and we combine it with well-studied classical protocols.
Who is LORETA neurofeedback for?
LORETA neurofeedback for adults, adolescents and children is always planned individually. People come to us for support with focus, stress, calm, sleep rhythm or performance. Whether this method fits your goals is discussed during the free telephone call and decided after the qEEG BrainMap.
How many sessions are needed?
The number of sessions depends on your goals and on how you respond to training. Our programmes include 10 or 15 sessions of one hour, with a BrainMap at the start and a reassessment at the end. We review progress together during the programme.
References
- Arns, M., Heinrich, H., & Strehl, U. (2014). Evaluation of neurofeedback in ADHD: The long and winding road. Biological Psychology, 95, 108–115.
- Coben, R., Hammond, D. C., & Arns, M. (2019). 19 channel Z-score and LORETA neurofeedback: Does the evidence support the hype? Applied Psychophysiology and Biofeedback, 44(1), 1–8.
- Collura, T. F., Guan, J., Tarrant, J., Bailey, J., & Starr, F. (2010). EEG biofeedback case studies using live Z-score training and a normative database. Journal of Neurotherapy, 14(1), 22–46.
- Grech, R., Cassar, T., Muscat, J., Camilleri, K. P., Fabri, S. G., Zervakis, M., Xanthopoulos, P., Sakkalis, V., & Vanrumste, B. (2008). Review on solving the inverse problem in EEG source analysis. Journal of NeuroEngineering and Rehabilitation, 5, 25.
- Krigbaum, G., & Wigton, N. L. (2014). When discussing neurofeedback, does modality matter? NeuroRegulation, 1(1).
- Palmero-Soler, E., Dolan, K., Hadamschek, V., & Tass, P. A. (2007). swLORETA: A novel approach to robust source localization and synchronization tomography. Physics in Medicine and Biology, 52(7), 1783–1800.
- Pascual-Marqui, R. D. (2002). Standardized low-resolution brain electromagnetic tomography (sLORETA): Technical details. Methods and Findings in Experimental and Clinical Pharmacology, 24(Suppl D), 5–12.
- Pascual-Marqui, R. D. (2007). Discrete, 3D distributed, linear imaging methods of electric neuronal activity. Part 1: Exact, zero error localization. arXiv preprint arXiv:0710.3341.
- Pascual-Marqui, R. D., Michel, C. M., & Lehmann, D. (1994). Low resolution electromagnetic tomography: A new method for localizing electrical activity in the brain. International Journal of Psychophysiology, 18(1), 49–65.
- Thatcher, R. W., North, D., & Biver, C. (2005). Evaluation and validity of a LORETA normative EEG database. Clinical EEG and Neuroscience, 36(2), 116–122.
- Wigton, N. L., & Krigbaum, G. (2015). A review of qEEG-guided neurofeedback. NeuroRegulation, 2(3).
- Wigton, N. L., & Krigbaum, G. (2019). Attention, executive function, behavior, and electrocortical function, significantly improved with 19-channel Z-score neurofeedback in a clinical setting: A pilot study. Journal of Attention Disorders, 23(4), 398–408.
Neurofeedback is brain training and is not a substitute for medical advice.