
What is the purpose of measuring the electrical activity of the brain?
To identify the origin of our difficulties, our discomfort or our symptoms: such as anxiety, depression, poor sleep, a tendency to rumination, cognitive difficulties, a Dys or ADHD disorder, autism, epilepsy, trauma…
Here is a non-exhaustive list of what can be observed through a 10-minute painless examination.
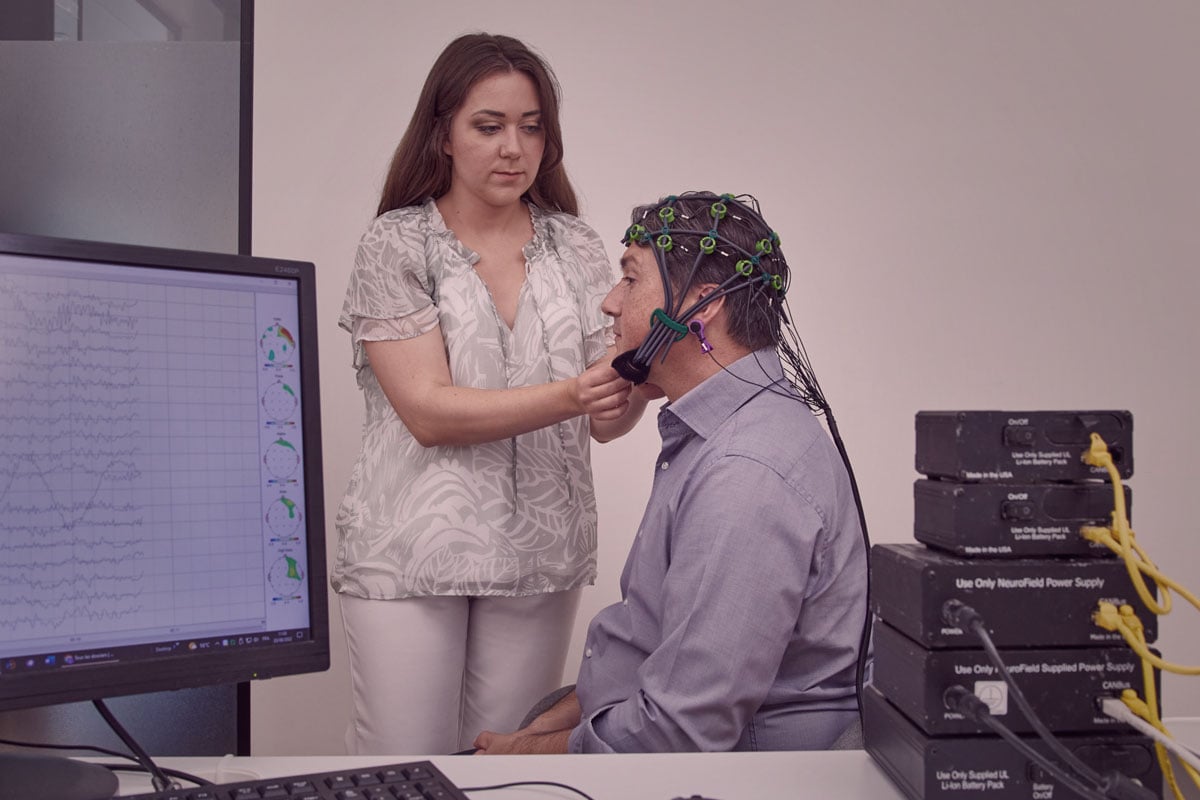
The electroencephalogram (EEG) is an examination conducted by a neurologist that allows precise measurement of electrical brain activity (different from chemical activity measured with a blood test). It consists of observing the pattern of waves over time. It is a non-invasive and painless examination, using a cap with 19 electrodes positioned on the head. The EEG can be used to detect epileptic activity or to check the quality of sleep.
The quantitative EEG (qEEG) provides precise and detailed information about the brain. It requires physical and mathematical analyses in order to calculate numerous parameters that can be quantified (brain waves, power, coherence…).
These analyses give a graphic representation (the Brainmap) of the cerebral electrical activity allowing the observation of brain deregulations. That is to say, the over- or under-activation of cerebral regions reflecting the functioning of the brain.
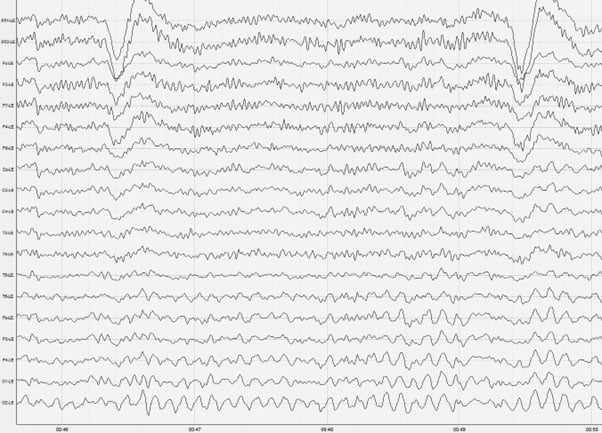
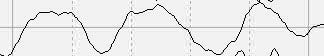
Example of a 19-channel EEG trace
At Neurofeedback Luxembourg, a quantitative EEG assessment is the first step before Neurofeedback sessions and is mandatory. We refuse to train a brain that we have not evaluated.
However, be aware that not all types of Neurofeedback practice use quantitative EEG. Make sure that a preliminary assessment is always performed.
To know the price of an EEG, consult our offers by clicking on the button at the top right of this page.
See the FAQ page to learn more about Quantitative EEG →
Also called brain mapping, it is the result of quantitative EEG analyses in the form of a graphical representation of electrical brain activity.
We have different types of waves in the brain, each of them has a very important role to play. What is important to observe is their quantity and their location in order to know if there are deregulations of the brain function (you want to see what a brain wave is? See the details at the bottom of this page).
Here is a small part of the results you will get:
| Waves | Delta | Theta | Alpha | Beta | High-beta |
| Role | Deep sleep, repair | Creativity, dreams, sleep | Relaxation, meditation | Cognitive activity | Hypervigilance |
| Standard |  & BrainMap 5") |  & BrainMap 6") |  & BrainMap 7") |  & BrainMap 8") |  & BrainMap 9") |
| Example of possible deregulations |
Shallow, unrefreshing sleep Fatigue or even exhaustion |
Shallow, unrefreshing sleep Fatigue or even exhaustion |
Sadness or even depression Brain in the moon |
Stress Impulsivity Ruminations |
Anxiety Body tensions Hypervigilance |
Here are, in part, the brain waves and their role (details below)
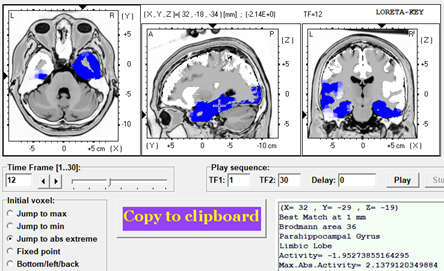
Loreta image: brain waves from deeper areas of the brain
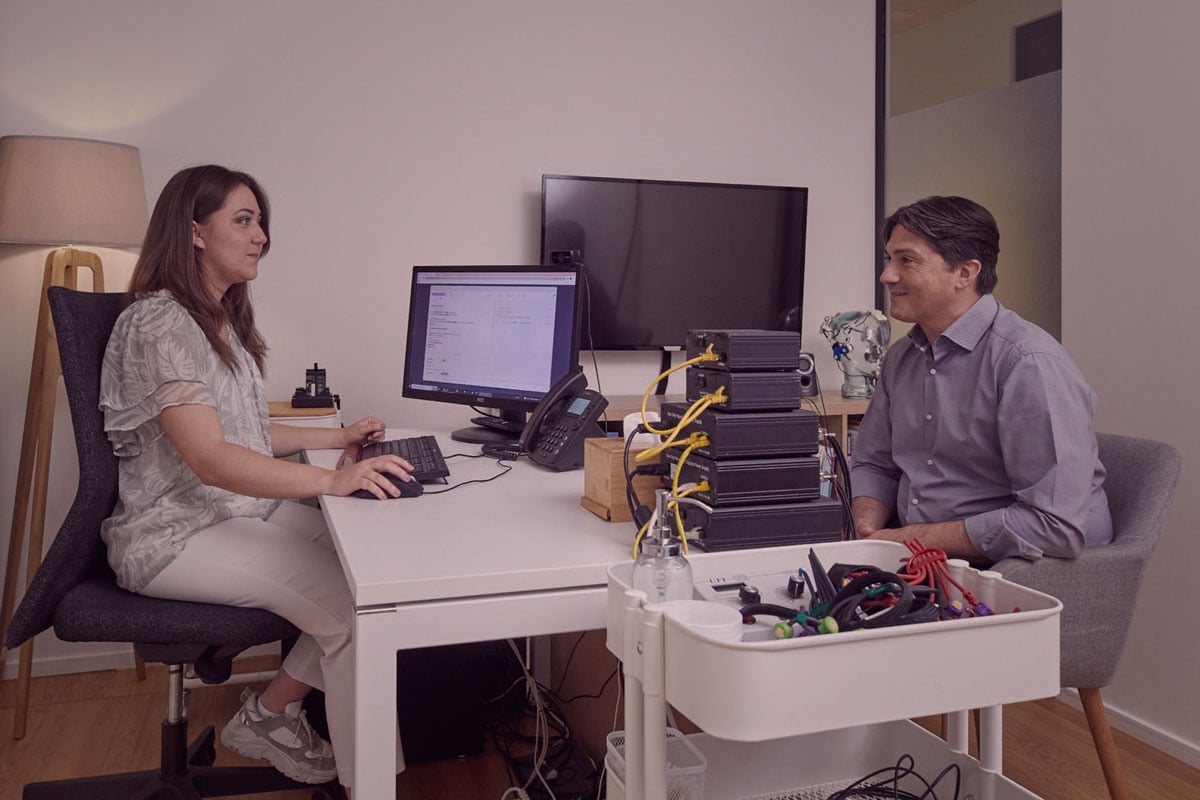
The first appointment lasts one hour and involves several steps:
That same day, a cognitive test is sent to you by email along with short questionnaires to be filled out on your computer. This step is mandatory in order to obtain your results.
All the results will be given back to you and explained during an appointment of one hour minimum. Detailed written reports will be given to you.
The results remain strictly confidential. However, it is possible to contact the professional(s) who are following you, at your request, to discuss the results.
Once you have obtained your results, you are not obliged to do Neurofeedback sessions, the choice is yours.
To do a quantitative EEG and get your BrainMap, go to our platform:
These are very slow waves ranging from 0.10 to 4Hz, present mainly during deep sleep (N3 phase of sleep). They are present in abundance in young children and are produced by the brainstem (area linking the brain and the spinal cord, also called the reptilian brain). This is the most primitive part of the brain and is responsible for subconscious functions such as heart rate and breathing patterns.
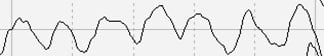
Theta waves range from 5 to 8Hz. They are present during light sleep (sleep phase N1 and N2) and are also involved in processes such as falling asleep, hypnosis and creativity. Theta waves are generated by the limbic system, the seat of emotions.
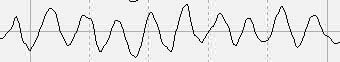
Alpha waves are between 9 and 12 Hz, but their frequency band can extend beyond these values. They are produced by the brain in states of relaxation, especially with the eyes closed. They are also known to be increased by meditation. They are produced by the thalamus, a major structure in the brain that centralizes and redistributes a large amount of information.
Beta waves represent a wide frequency band from 13 to 30Hz. Three subtypes can be distinguished:
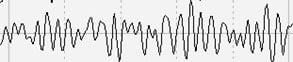
They are generated directly by the cerebral cortex, being the most superficial layer of the brain.
| Brain waves | Meaning | Cerebral generators | Examples of anomalies | |
| If in excess | If in deficiency | |||
Delta (0.10 – 4Hz) | Deep sleep Present in abundance in infants and very young children | Brain stem | Developmental delay, cognitive slowdown, pain, inflammation | Decreased or no deep sleep, no real rest, serotonin deficiency. Fatigue or even exhaustion |
Theta (4-8Hz) | Hypnagogic state, creativity, dreams, sleep | Limbic system | Attention, concentration and memory problems, cognitive slowdown, head trauma or psychic trauma | Difficulty falling asleep, fatigue or even exhaustion |
Alpha (9-12Hz) | Relaxed state, relaxation, meditation | Thalamus | Depression, moments of absence, ruminations | Anxiety, malaise, inability to relax |
Beta (13-20Hz) | Active, attentive, focused state | Cerebral cortex | Stress, rumination, nervousness, hyperactivity | Anxiety, fatigue, exhaustion |
High-Beta (21-30Hz) | State of agitation, alertness and even anxiety | Cerebral cortex | Agitation, anxiety, hyperactivity, hypervigilance | Anxiety, fatigue, exhaustion |
When to have an EEG? When you have symptoms that impact your daily life
This is the absolute amount of waves present. Each frequency band is compared to the average value of the normative database of subjects of the same age and sex as you. Your brain activity is compared to your reference population to see if your activity is within the norm.
This measures the distribution of your own brain waves in relation to each other and allows you to see how your brain chooses to redistribute the amount of energy it has for the day, how it distributes the waves.
It is a measure of the synchronization of the waves between them. A high coherence reflects a too strong synchronization, while a low coherence reflects a lack of synchronization (information across brain regions is poorly transmitted).
Attention: do not confuse norm with normality! Your brain is compared to the norm, to see if it is there or not, but know that normality does not exist!
So a normal EEG means nothing.
The norm is represented by the graph below: the Gausse normal distribution curve. It is defined via the Z-Scores, the standard deviations (σ: -3 to +3) around the mean μ (0).
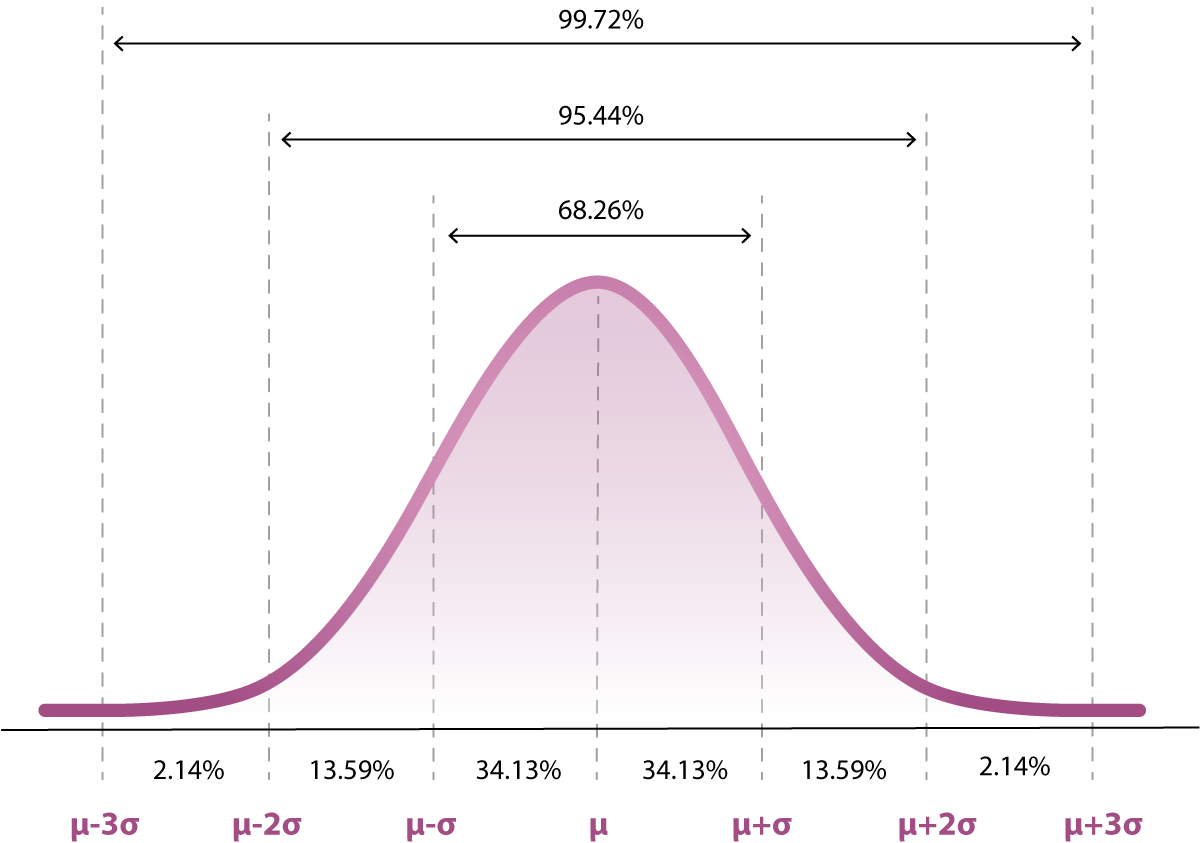
Gausse distribution curve
For example, the height, weight or intelligence quotient of a human being has a so-called normal distribution. That is, a large majority of the population has a so-called average height (the norm μ – absolute average). However, the entire population does not have the same average normative height to the nearest mm, there is a natural variation between individuals: some measure 1m52, others will measure 1m65, yet they are still considered within the norm. The natural variability is between -1 and +1 Z-score, which represents 68% of the individuals.
Beyond these measurements, we speak of deviations from the norm, which indicate the presence of problems or difficulties of some kind, depending on what is being measured.
The same applies to brain waves, which have a normal distribution. What is important to know is whether a measured value really deviates from the norm.
Talk to a specialist over the phone to determine together the solution that best suits your needs and budget.
Free call with no obligation.
We promise we will only send you quality content. You can unsubscribe at any time.
We promise we will only send you quality content. You can unsubscribe at any time.
We promise we will only send you quality content. You can unsubscribe at any time.
 & BrainMap 10")
 & BrainMap 11")
 & BrainMap 12")
 & BrainMap 13")
 & BrainMap 14")