Looking to measure your heart rate variability (HRV)? A heart rate variability calculator can help you do just that. This article explains how to use a heart rate variability calculator, what metrics to input, and what results you can expect. By the end, you’ll know how to monitor your HRV for better health insights.
Key Takeaways
Heart Rate Variability (HRV) is a vital health indicator that reflects the functioning of the autonomic nervous system and the body’s ability to adapt to stress.
Key metrics for calculating HRV include SDNN, RMSSD, and pNN50, which collectively provide insights into cardiovascular health and autonomic control. HRV metrics are also used to assess cardiovascular health and emotional resilience.
Accurate HRV measurement relies on reliable tools, understanding factors influencing readings, and avoiding common mistakes in data collection and analysis.
Understanding Heart Rate Variability (HRV)

Heart rate variability (HRV) measures the variation in time between consecutive heartbeats, known as RR intervals. This seemingly simple metric provides a wealth of information about the autonomic nervous system (ANS), which controls involuntary bodily functions like heart rate and digestion. HRV serves as a non-invasive marker for the functioning of the ANS, offering insights into how well your body can adapt to stress and environmental changes.
The actions of the autonomic nervous system (ANS) are crucial in controlling heart rate variability. The balance between the sympathetic and parasympathetic branches of the ANS determines HRV levels. A higher HRV indicates a robust ability to adapt to environmental changes and is a sign of good cardiovascular fitness and overall health. Conversely, lower HRV is associated with increased mortality rates, particularly in aging populations, and can signal underlying health issues, including cardiovascular disease and myocardial infarction. Additionally, lower HRV is associated with chronic stress, anxiety, and depression.
Monitoring HRV serves as an early warning system for potential health problems. For instance, low HRV has been linked to conditions such as atrial fibrillation and abnormal heart rhythms. On the other hand, a higher HRV is associated with greater health and well-being, indicating a healthy balance between the sympathetic and parasympathetic nervous systems. Low HRV is also associated with elevated levels of inflammation in the body.
In summary, HRV is not just a measure of heart rate; it is a vital indicator of overall health and well-being. Monitoring your HRV offers valuable insights into cardiovascular fitness, enabling proactive health improvements. HRV has also been shown to predict morbidities related to mental and physical disorders.
Key Metrics for Calculating HRV
When it comes to calculating heart rate variability (HRV), several key metrics are used to assess the functioning of the autonomic nervous system. The standard deviation of normal-to-normal intervals (SDNN) is a commonly used metric. This metric reflects the overall variability in heart rate and is calculated from the time intervals between consecutive normal heartbeats. Lower SDNN values are associated with higher risks of morbidity and mortality, making it a critical indicator of health outcomes.
The root mean square of successive differences (RMSSD) quantifies short-term heart rate variations. RMSSD is closely related to vagal activity, reflecting the parasympathetic nervous system’s influence on heart rate. This metric is particularly useful for assessing how well your body can recover from stress and adapt to changes.
The pNN50 metric measures the percentage of adjacent normal-to-normal intervals that differ by more than 50 milliseconds, indicating parasympathetic activity. This metric is calculated based on the proportion of successive intervals that show significant differences, providing insights into the autonomic nervous system’s functionality.
These metrics—SDNN, RMSSD, and pNN50—are vital in HRV analysis, offering a comprehensive view of autonomic function. Understanding these metrics provides valuable insights into cardiovascular health, enabling proactive steps to improve HRV and overall well-being.
How to Use an HRV Calculator
Using an HRV calculator involves measuring the RR intervals, which reflect the time between consecutive heartbeats. To get started, you’ll need to input the standard deviation of normal RR intervals (SDNN) and the root mean square of successive differences, including successive rr interval differences, into the calculator. These metrics provide a comprehensive view of your heart rate variability, rr interval series, rr interval variability, and autonomic nervous system health.
HRV measurements can be taken over different durations, ranging from 24 hours to short-term (5 minutes) and ultra-short-term periods. Reliable results require monitoring heart rhythm for durations typically ranging from 5 minutes to 24 hours. Modern wearable devices, such as fitness trackers and smartwatches, have made it easier to calculate HRV without specialized medical equipment.
The formula used in HRV calculators, HRV = SDNN / RMSSD, provides insights into your autonomic nervous system’s health. Regular use of an HRV calculator allows you to track changes and make informed health decisions. Higher levels of resting vagally-mediated HRV are linked to better performance in executive functions like attention.
Popular HRV Calculation Methods
There are three primary methods for calculating heart rate variability (HRV): time-domain analysis, frequency-domain analysis, and nonlinear techniques. Each method offers unique insights into HRV and autonomic nervous system function, making them essential tools for comprehensive HRV analysis.
Time-domain analysis is the most straightforward method, based on the successive RR interval values to assess heart rate variability. This method quantifies the amount of HRV observed during monitoring periods and includes common measures like SDNN and RMSSD.
Frequency-domain analysis estimates power spectrum density for RR intervals, typically using Fast Fourier Transformation (FFT) or autoregressive methods. This method divides the HRV spectrum into different frequency bands, providing insights into the balance between sympathetic and parasympathetic activity through detrended fluctuation analysis.
Nonlinear analysis techniques quantify the unpredictability and complexity of heart rate regulation, offering insights beyond traditional linear measures. These methods include Poincaré plot analysis, approximate entropy, and correlation dimension, each providing a unique perspective on HRV.
Utilizing these HRV calculation methods offers a comprehensive view of heart rate variability and autonomic nervous system health.
Time-Domain Analysis
Time-domain analysis quantifies the amount of heart rate variability observed during monitoring periods. This method includes commonly used metrics such as the standard deviation of normal-to-normal intervals (SDNN) and the root mean square of successive differences (RMSSD), both of which are essential in HRV analysis.
The range of monitoring periods for time-domain HRV measurements can vary from as short as 1 minute to over 24 hours, depending on the specific application. For resting baselines, a minimum of 1 minute may suffice, while longer durations provide more comprehensive insights.
The NN50 metric, defined as the number of successive intervals differing by more than 50 milliseconds, is another important measure in time-domain analysis. These values can be expressed in their original units or as the natural logarithm (Ln) of those units, providing flexibility in data representation.
Time-domain measures offer valuable insights into heart rate variability and autonomic nervous system function.
Frequency-Domain Analysis
Frequency-domain analysis estimates power spectrum density for RR intervals, using techniques like Fast Fourier Transformation (FFT) or autoregressive methods. This method divides the HRV spectrum into different frequency bands, each with specific physiological interpretations, and can be represented in an rr interval histogram divided.
The very low frequency (VLF) band is defined between 0.0033 to 0.04 Hz, while the high frequency (HF) band covers 0.15 to 0.40 Hz. The HF band reflects parasympathetic activity, indicating how well your body can recover from stress and maintain balance. The low-frequency (LF) power measures the balance between sympathetic and parasympathetic activity.
Absolute power in frequency-domain measurements indicates the signal energy within these frequency bands, with factors like the measurement period influencing the results. Understanding these frequency bands provides deeper insights into heart rate variability and autonomic nervous system health.
Nonlinear Analysis Techniques
Nonlinear analysis methods quantify the unpredictability and complexity of heart rate regulation, providing insights beyond traditional linear measures. One of the key techniques used in nonlinear analysis is the Poincaré plot, a scatter plot of successive RR intervals. This plot allows researchers to visually search for patterns and quantify the relationship between intervals. Approximate entropy (ApEn) measures the irregularity of RR interval data, with higher values indicating greater complexity.
Approximate entropy measures the complexity of a signal, with higher values indicating more irregularity and lower values suggesting a more regular signal. This metric provides insights into the autonomic nervous system’s functionality and adaptability. Sample entropy (SampEn) provides a less biased measure of signal regularity compared to ApEn.
The correlation dimension estimates the minimum number of variables required to capture the dynamics of a system, with higher dimensions indicating greater complexity in the data. Nonlinear analysis techniques offer a comprehensive understanding of heart rate variability and autonomic nervous system health.
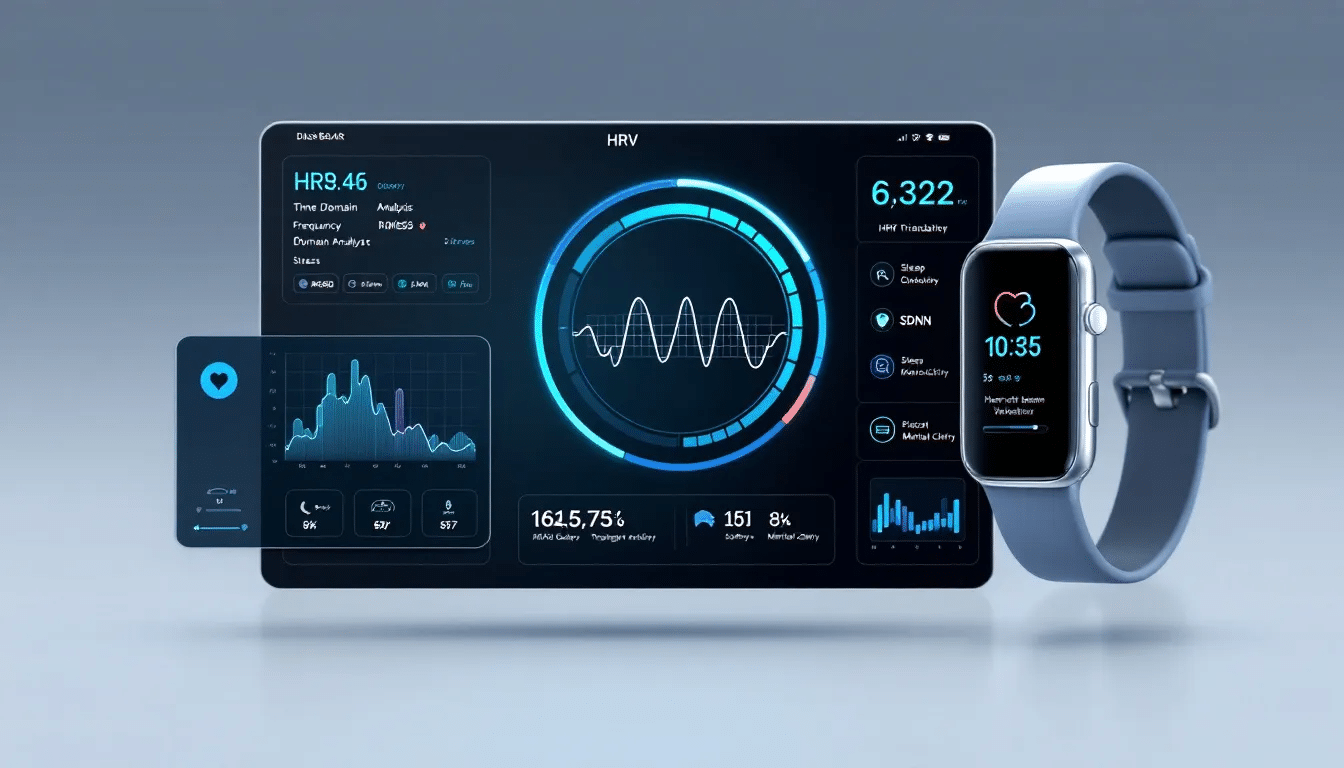
Tools and Devices for Measuring HRV

Measuring heart rate variability (HRV) accurately requires reliable tools and devices. One of the most accurate methods is using an electrocardiogram (EKG), which visually represents heartbeat intervals and provides precise HRV measurements. However, EKGs are typically used in clinical settings and may not be practical for everyday use.
Wearable devices like smartwatches and fitness bands have revolutionized HRV monitoring, enabling long-term tracking and providing valuable health data. Many popular smartwatches automatically track HRV during sleep and while exercising, offering convenience and ease of use.
Chest straps and mobile apps provide additional options for measuring HRV at home. These devices are designed to offer accurate measurements and are ideal for individuals seeking to monitor their HRV regularly.
It’s important to use reliable devices for accurate HRV readings, as inaccurate heart rate monitors can lead to misleading values. Choosing the right tools and devices ensures precise HRV measurements and valuable cardiovascular health insights.
Factors Influencing HRV Readings
Several factors can influence HRV readings, including age, gender, genetics, and lifestyle choices. For instance, smoking negatively affects HRV, with recommendations to avoid tobacco for at least 10 hours prior to assessment. Alcohol intake can also acutely lower HRV; abstaining from alcohol for at least 24 hours before measurement is recommended.
Physical activity levels play a crucial role in HRV measurements. While moderate exercise can improve HRV, high-intensity workouts shortly before measurement may decrease it. Abnormal HRV patterns can signal underlying health issues, including stress and cardiovascular diseases.
Physiological factors such as age and genetics can lead to individual differences in HRV measurements, with aging generally associated with reduced HRV. Controlling respiration is important, as variations in breathing rates can significantly affect HRV outcomes. Women typically present higher HRV values compared to men, reflecting relative vagal dominance.
Environmental conditions like temperature and noise can also alter HRV; stable ambient conditions are preferred for accurate readings. Maintaining a consistent body position during HRV assessment is essential, as different postures can lead to variable HRV results. Additionally, the duration of HRV recordings matters; a minimum of 5 minutes is generally necessary for reliable short-term HRV analysis.
Understanding these factors ensures accurate HRV readings and meaningful health insights.
Improving Your HRV

Improving your heart rate variability (HRV) is crucial for overall health, as it reflects the body’s ability to adapt to stress and regulate autonomic functions. One of the fundamental ways to support HRV is by maintaining proper hydration and a balanced diet rich in fruits, vegetables, and lean proteins. A poor diet can lead to lower HRV, increasing the risk of cardiovascular diseases and other health issues.
Engaging in regular aerobic exercise, such as jogging or cycling, can significantly improve HRV by achieving a balance in the autonomic nervous system. Physical activity helps in boosting parasympathetic nervous system activity, which is associated with higher HRV. However, it’s important to avoid excessive high-intensity workouts shortly before HRV measurement, as they can temporarily lower HRV.
Practicing stress-reducing activities like meditation and deep breathing can significantly boost HRV. These activities help in reducing sympathetic nervous system activity and promoting parasympathetic nervous system activity, leading to higher HRV. Tracking HRV can help individuals identify patterns and make lifestyle adjustments related to stress and fitness.
Avoiding excessive alcohol consumption and smoking is also crucial for maintaining a healthy HRV. Both alcohol and tobacco have been shown to acutely lower HRV, increasing the risk of cardiovascular diseases and other health issues. Making these lifestyle changes improves HRV and enhances overall health and well-being.
In summary, improving HRV involves a combination of:
Proper hydration
A balanced diet
Regular aerobic exercise
Stress reduction
Avoiding harmful substances like alcohol and tobacco
By making these changes, you can enhance your cardiovascular health and overall well-being.
Common Mistakes in HRV Calculation
Accurate heart rate variability (HRV) calculation requires attention to detail and proper methodology. One common mistake is not accurately preprocessing the data before analysis. This can lead to errors in HRV calculation and misinterpretation of results. It’s essential to use reliable devices and software designed for precise HRV measurements.
Another common mistake is not considering the impact of nonlinear HRV analysis methods. These methods can complicate the physiological interpretation of results, making it challenging to draw meaningful conclusions. It’s important to understand the limitations of different HRV analysis methods and choose the appropriate one for your needs.
Failing to account for factors that influence HRV readings can also lead to inaccurate results. For instance, not controlling for factors like age, gender, smoking, alcohol consumption, and physical activity levels can significantly distort HRV measurements. Ensuring consistent measurement conditions and considering these factors is crucial for accurate HRV analysis.
Using unreliable or inaccurate heart rate monitors can lead to misleading HRV values. It’s essential to use devices designed for precise HRV measurements and follow the manufacturer’s guidelines for accurate data collection.
Finally, improper data collection and analysis techniques can result in errors in HRV calculation. Ensuring accurate preprocessing, using reliable devices, and following proper data collection and analysis techniques are essential for obtaining meaningful HRV insights. Avoiding these common mistakes ensures accurate HRV calculation and valuable cardiovascular health insights.
Summary
Heart rate variability (HRV) is a powerful tool for understanding your cardiovascular health and overall well-being. By measuring the variation in time between heartbeats, HRV provides insights into the functioning of the autonomic nervous system and your body’s ability to adapt to stress and environmental changes.
The key metrics used in HRV analysis, including SDNN, RMSSD, and pNN50, offer valuable information about autonomic function and can help predict health outcomes. Popular HRV calculation methods, such as time-domain, frequency-domain, and nonlinear techniques, provide a comprehensive view of HRV and its implications for health.
By using reliable tools and devices for HRV measurement, understanding the factors that influence HRV readings, and making lifestyle changes to improve HRV, you can take control of your health and well-being. HRV is not just a measure of heart rate; it’s a vital indicator of your body’s resilience and adaptability. Take the first step towards better health by monitoring and improving your HRV.
Frequently Asked Questions
What is HRV, and why is it important?
HRV, or heart rate variability, measures the time variation between heartbeats and serves as an essential indicator of cardiovascular health and autonomic nervous system function. Its importance lies in providing insights into the body’s ability to adapt to stress and environmental changes.
What are the key metrics used in HRV analysis?
The key metrics used in HRV analysis are SDNN, RMSSD, and pNN50, which evaluate various aspects of heart rate variability and autonomic function, yielding important insights into health.
How can I improve my HRV?
To enhance your HRV, focus on maintaining proper hydration, following a balanced diet, engaging in regular aerobic exercise, and reducing stress. Additionally, it is important to avoid harmful substances like alcohol and tobacco.
What tools can I use to measure HRV?
To measure HRV effectively, you can use electrocardiograms (EKG), wearable devices such as smartwatches and fitness bands, chest straps, and specialized mobile apps. These tools offer convenient and accurate options for monitoring heart rate variability.
What factors can influence HRV readings?
HRV readings can be significantly influenced by factors including age, gender, smoking, alcohol consumption, physical activity, respiration, and environmental conditions. Consistency in measurement conditions is essential for accurate analysis.